Delivered · in first use
Tenancy analysis from a valuation export
Rebuild the spreadsheet so it cannot quietly go wrong, then check every figure against a second calculation.
- 267
- figures re-checked against an independent calculation
- 2
- export formats read, columns matched by name
- 12
- charts sized to drop into a Word report
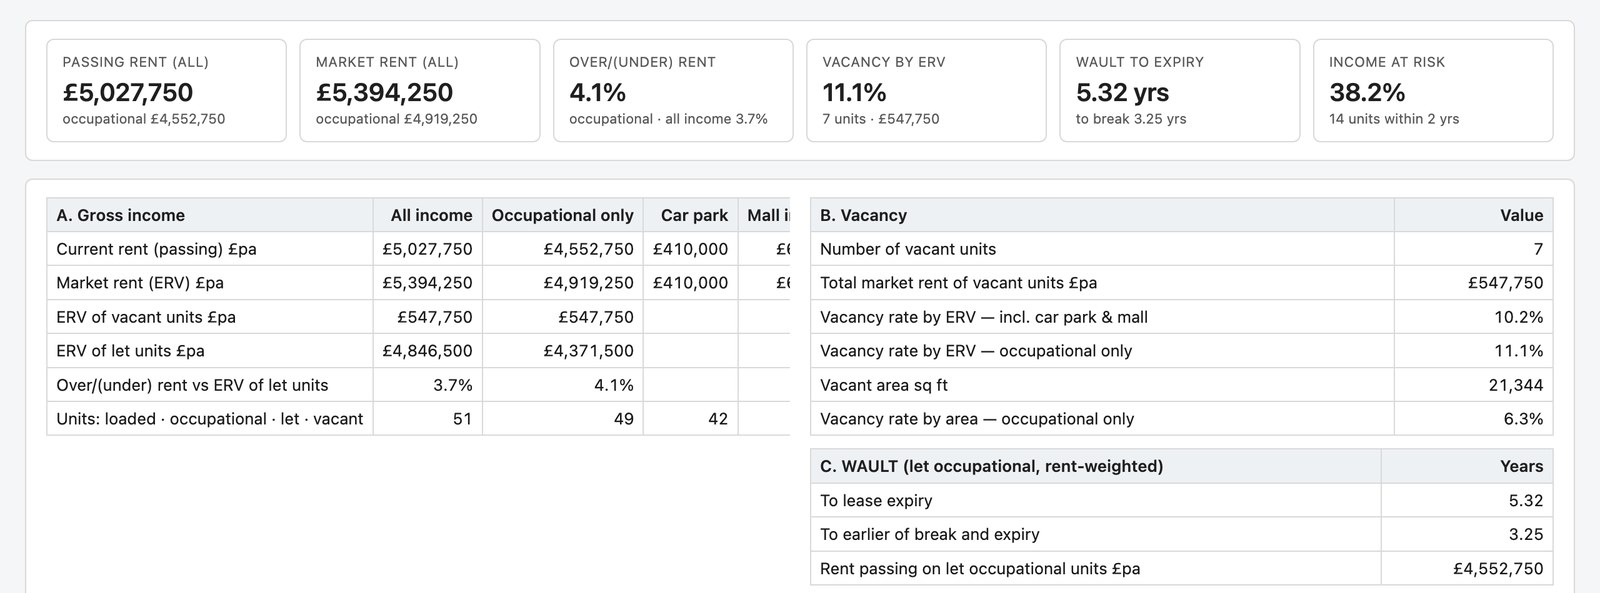
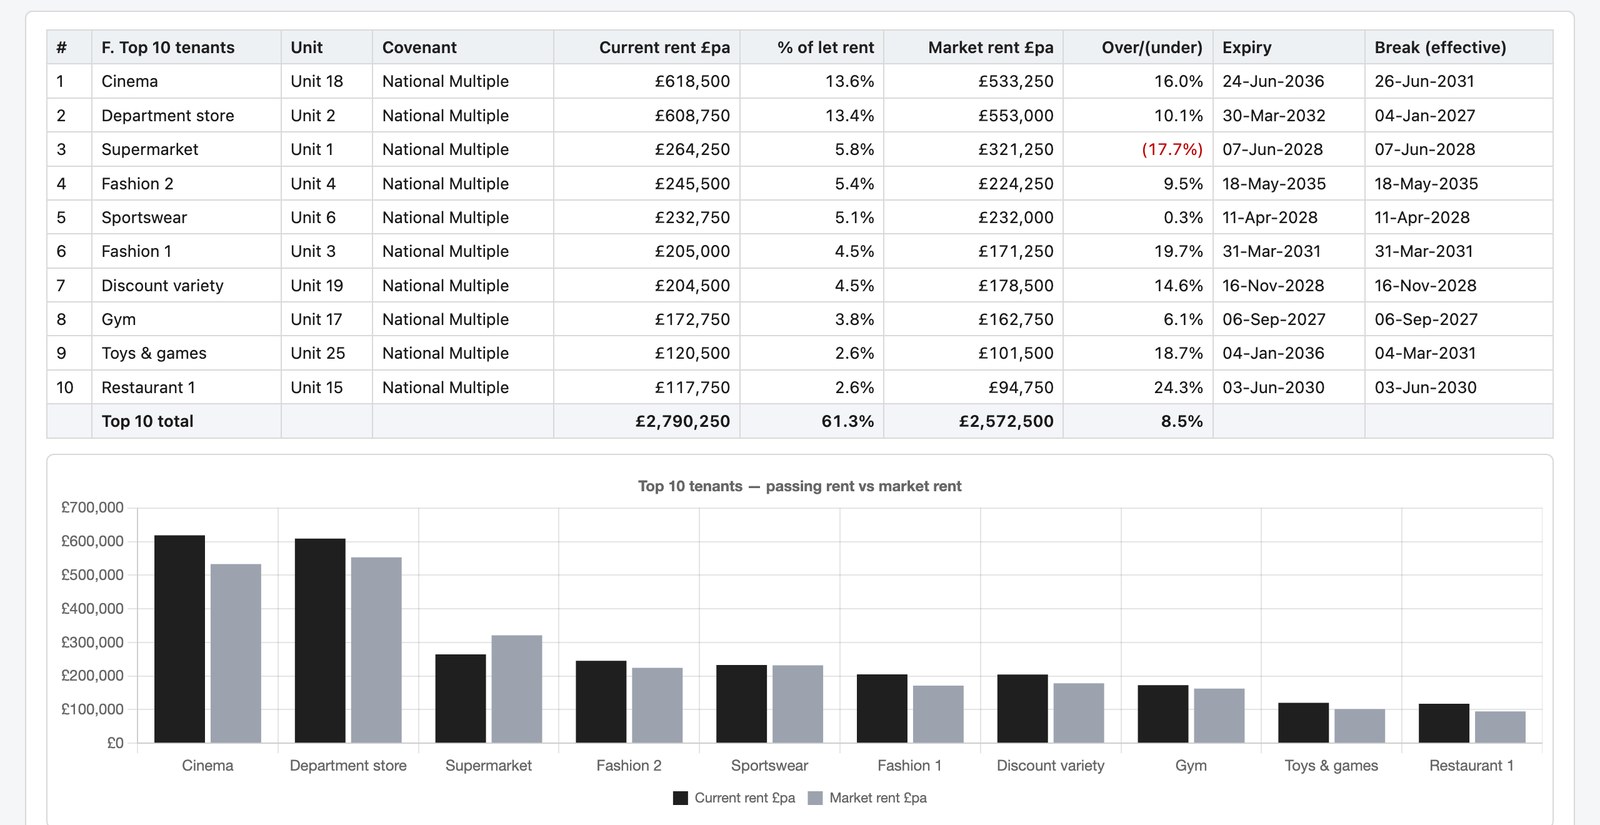
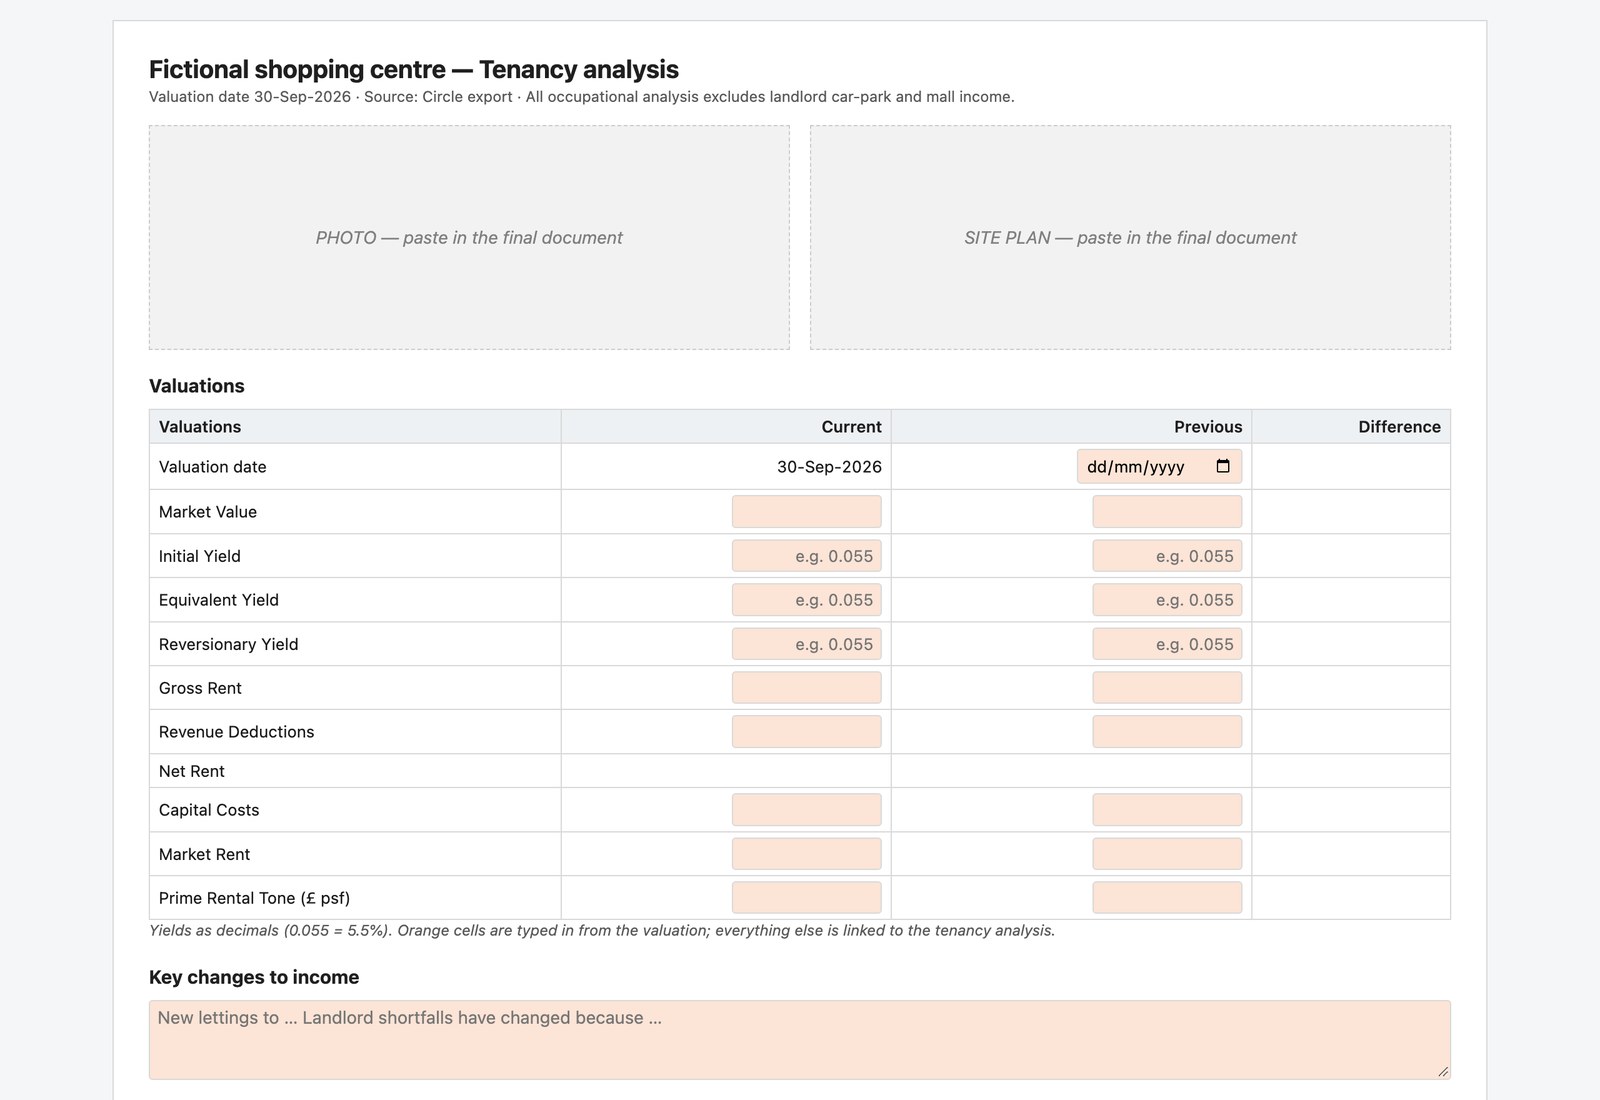
A colleague's team values shopping centres and other multi-let property. Each valuation starts with a tenancy schedule exported from the valuation software, pasted into a spreadsheet that works out the figures the report needs: income, vacancy, WAULT, covenant split, the expiry profile, the top tenants, and the income at risk over the next two years. The spreadsheet worked, most of the time. It had grown fragile in ordinary ways, and they asked whether it could be made to take exports from a second software package as well.
What was wrong with the old one
Nothing dramatic. Each problem was small and easy to miss:
- formulas stopped at a fixed row, so a large schedule lost its last tenants without warning;
- two pivot tables had to be refreshed by hand, and when they weren't, two report sections showed errors;
- one lookup only worked because a column header in the export ended with a space;
- vacant units that still carried a rent in the export were counted as let, which lifted the WAULT and the top-ten total.
None of these produces an obviously wrong number, which is why they matter: a figure that is slightly wrong and looks fine ends up in a report.
How the rebuild works
- Columns are found by their header. One sheet lists the header each figure reads, per software package. If an update renames a column, someone edits that cell and every formula follows.
- Nothing to refresh, nothing to sort. Every list re-ranks itself from formulas when the input changes. The row limit is 1,500 tenancies, and the checks go red if a schedule is larger.
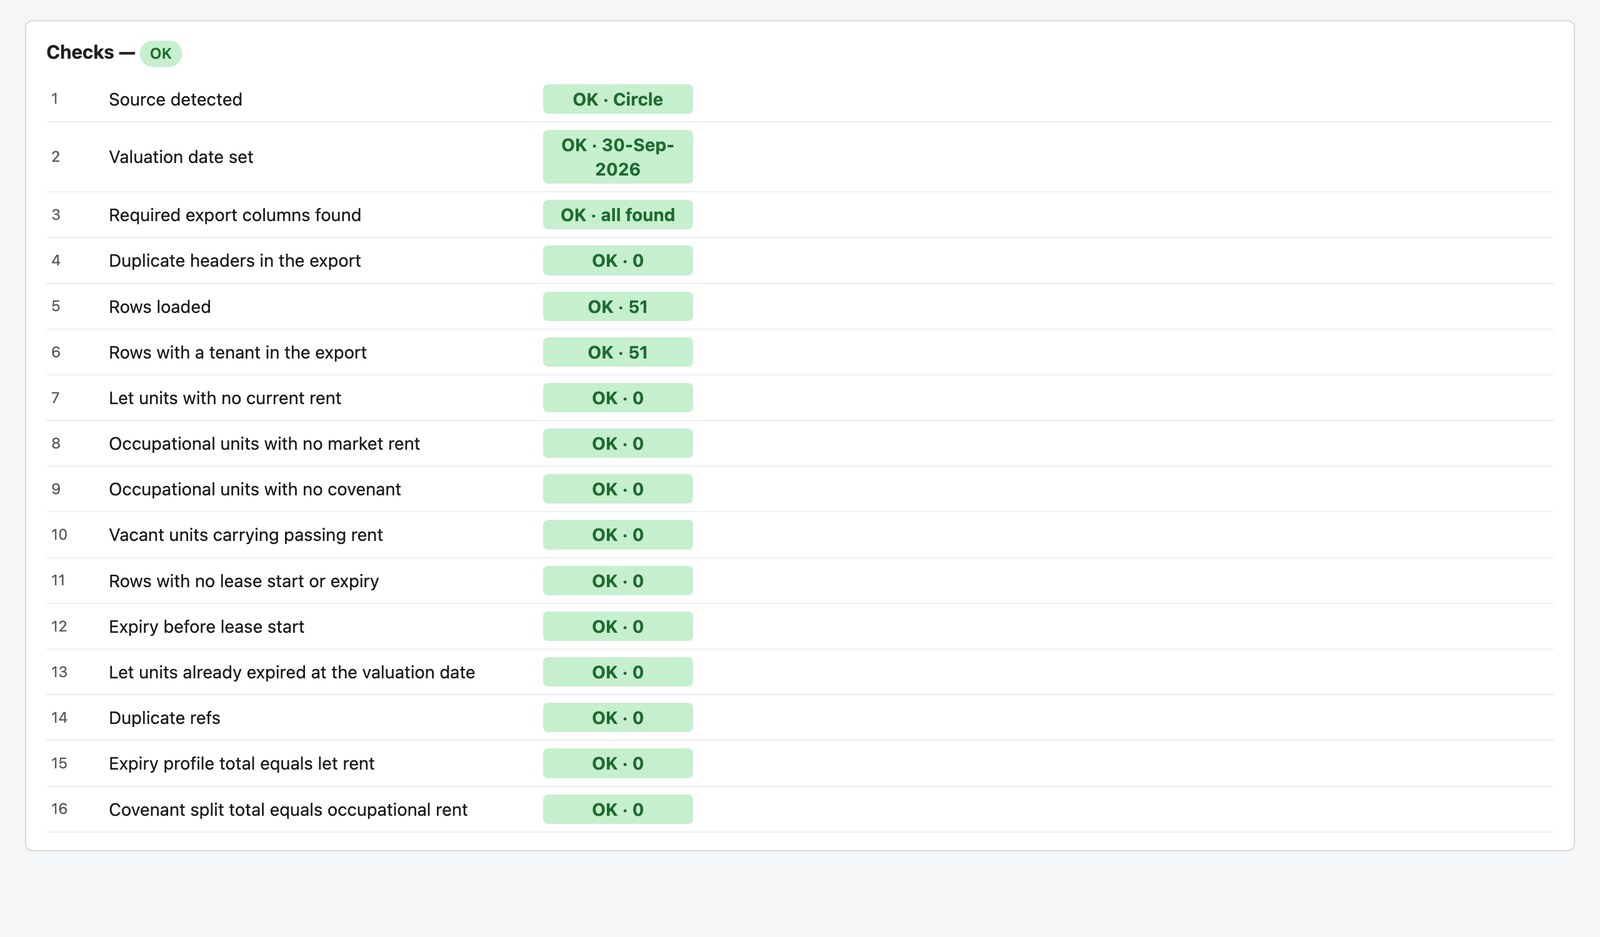
- A checks sheet before any figure is trusted. Required columns found, rows loaded against rows in the export, dates that make sense, covenants filled in, and totals that reconcile. Green means read on. Red means fix the input first.
- Classic formulas only. No macros, no pivot tables, no dynamic arrays: only functions that have been in Excel since 2010.
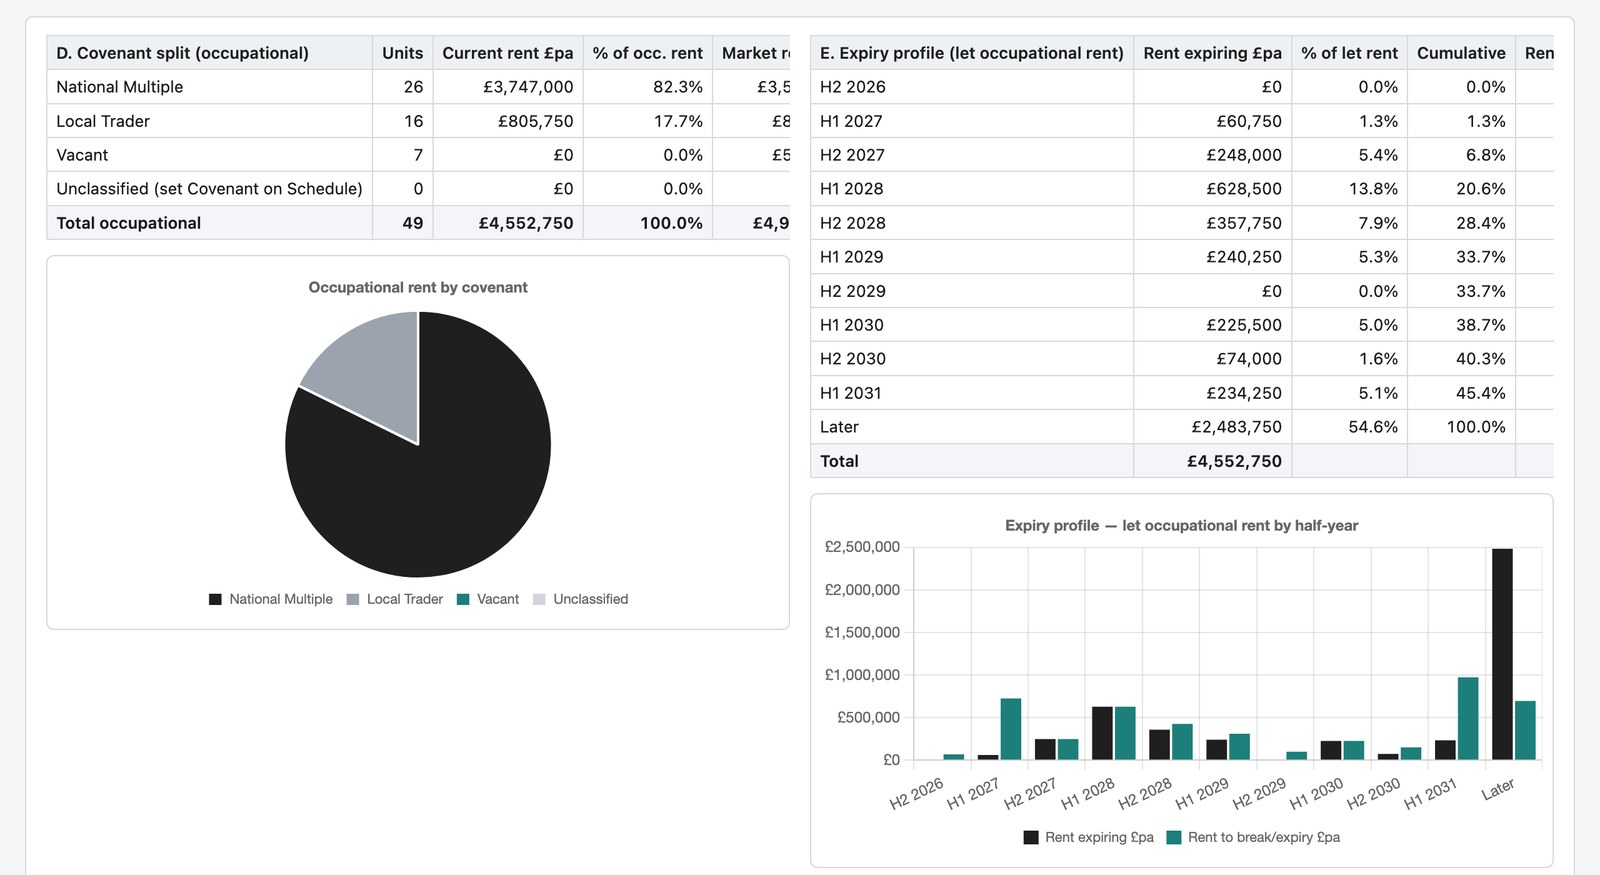
- Charts sized for the report. The valuer's real output is a Word report, so the twelve charts sit together on one sheet, each at the width of a Word page, with the values and percentages labelled on the chart, ready to paste in as a picture. They include an income run-off chart showing contracted rent falling away as leases expire or break.
Checking it
I checked every figure against a second calculation, written separately in Python from the raw export and sharing no formulas with the spreadsheet. On the worked example, all 267 figures agree. Where the new figures differ from the old spreadsheet's, the difference is explained: the vacant-units-with-rent case accounts for the gap in WAULT, and a new line on the checks sheet now flags it.
The version that didn't win
I also built a single-file browser version. It reads the same exports, shows the charts on screen and needs no install, and the colleague who tried it said it worked. It is still the secondary version. Work machines block local web pages, so the spreadsheet is the one that runs where the work happens, and the spreadsheet is where the chart work went next.